
Data chart · CreditUnionAI News
Most credit unions had fewer members. Start the growth discussion with a reconciliation.
About 56% of federally insured credit unions ended June 2026 with fewer members than a year earlier, according to NCUA’s latest quarterly map review. Total membership across the system still grew.
Those measures answer different questions. The chart counts each institution equally. System growth reflects the change in all reported memberships combined, so gains at some credit unions can outweigh declines at others.
For a leadership team reviewing its own results, the useful next step is a membership bridge: opening members, plus joins, minus exits, plus or minus documented adjustments, equals closing members. Reconcile it to the reported total before deciding where to intervene.
Our editorial recommendation: have the membership and finance teams separate acquisition, departures and reporting adjustments, then examine the largest unexplained movement. A net decline alone cannot tell you whether to change onboarding, retention or marketing.
The same bridge can make a growth story more useful, too. It shows whether gains are broad-based, concentrated in one channel or affected by a merger or another adjustment.
Data chart ·
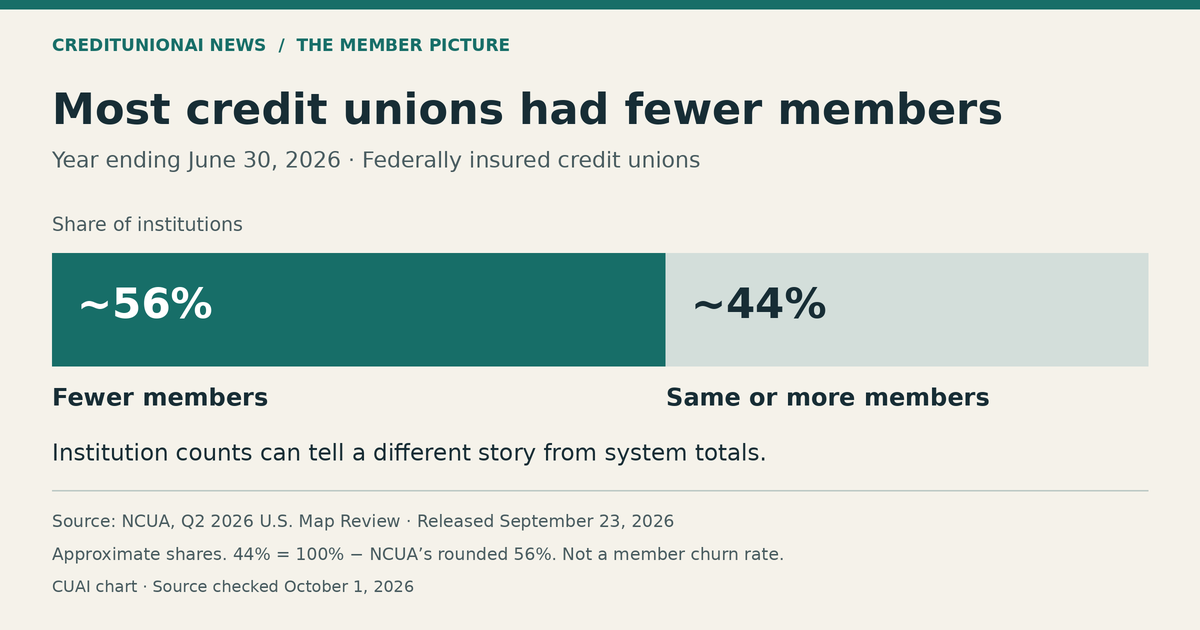
Share of federally insured credit unions by year-over-year membership change, June 30, 2025–June 30, 2026. Approximately 44% is calculated as 100% minus NCUA’s rounded 56%. Each institution counts equally; this is not a member churn rate.
Period: June 30, 2025–June 30, 2026. Units and denominator: approximate percentage of federally insured credit unions; each institution counts equally. Source: NCUA Q2 2026 U.S. Map Review. Original CUAI chart using public NCUA data. Released September 23, 2026; source checked October 6, 2026. The unchanged PNG retains its original October 1 source-check label.
Read the chart data
| Membership change | Approximate share of institutions |
|---|---|
| Fewer members | About 56% |
| Same or more members | Approximately 44% (100% − rounded 56%) |
Sources and method
The membership bridge is CUAI’s editorial recommendation, not a finding or requirement attributed to NCUA. Joins, exits and documented adjustments must reconcile to the reported closing total before the team interprets a change.